Oakmark Fund - Investor Class
Average Annual Total Returns 09/30/18
Since Inception 08/05/1991 12.89%
10-year 13.11%
5-year 12.57%
1-year 11.84%
3-month 4.24%
Gross Expense Ratio as of 09/30/17 was 0.90%
Net Expense Ratio as of 09/30/17 was 0.86%
Oakmark Select Fund – Investor Class
Average Annual Total Returns 09/30/18
Since Inception 11/01/96 12.27%
10-year 12.80%
5-year 9.81%
1-year -0.08%
3-month 0.28%
Gross Expense Ratio as of 09/30/17 was 1.03%
Net Expense Ratio as of 09/30/17 was 0.96%
Past performance is no guarantee of future results. The performance data quoted represents past performance. Current performance may be lower or higher than the performance data quoted. The investment return and principal value vary so that an investor’s shares when redeemed may be worth more or less than the original cost. To obtain the most recent month-end performance data, view it here.
Fiscal-year 2018 closed with a thud for Oakmark and Oakmark Select as both Funds’ positive returns trailed the S&P 500’s gains. As is typical, when the stocks we own in Oakmark underperform the market, the stocks we believe are most attractive and own in the more concentrated Oakmark Select Fund underperform by even more. As of quarter end, both Funds lagged behind the S&P 500 on a trailing one-, three- and five-year basis. As portfolio managers and fellow investors, we are as frustrated with those numbers as you are.
While many fund managers avoid talking about their underperformance, we’d prefer to confront ours head on. The goal of this commentary is to put our performance in perspective, explain why it happened and give you a framework for deciding what, if anything, to do about it. Because Oakmark is the more diversified portfolio and, therefore, holds more stocks than Oakmark Select, it provides more examples for this discussion, so it will be the focus of this piece. The Oakmark Select report will use a similar format to review specifics of that Fund.
First, let’s put underperformance in context. The Oakmark Fund was started in August 1991. An investor who bought and held the S&P 500 from that date until now has earned slightly more than 13 times their initial investment. An investor who bought and held the Oakmark Fund for the same period now has earned nearly 27 times their initial investment—more than twice the capital of the S&P 500 investor. Despite that long-term record, the Fund has endured many periods when the S&P 500 fared better. Oakmark trailed the S&P 500 in 50% of the rolling 12-month periods. Over rolling three-year increments, the Fund still underperformed 47% of the time. Even if we look across five-year increments, Oakmark trailed the S&P 500 in 31%. All that underperformance came despite more than doubling the S&P 500’s return over 27 years.
At Oakmark, we are long-term investors. We attempt to identify growing businesses that are managed to benefit their shareholders. We will purchase stock in those businesses only when priced substantially below our estimate of intrinsic value. After purchase, we patiently wait for the gap between stock price and intrinsic value to close.
Some long-term investors might say there is no excuse for a five-year period of underperformance. They could decide to buy a fund after its five-year record exceeds the market return and sell that fund when its five-year record trails the market. We analyzed how that strategy would have worked for an investor in the Oakmark Fund who reviewed their position at every month end. We assume this investor used proceeds from their Oakmark sales to invest in an S&P 500 index fund. Following this approach over the Fund’s history, this “in-and-out” investor would have bought and sold the Fund for eight round trips. The return achieved by that investor would have fallen short of just buying and holding the S&P 500. Here are the results based on an initial investment of $10,000 in August 1991:
| Strategy | Ending Capital |
|---|---|
| Oakmark Buy and Hold | $268,700 |
| S&P 500 Buy and Hold | $132,000 |
| Oakmark/S&P 500 “in-and-out” | $122,200 |
Clearly, performance chasing has been futile. (Further, the “in-and-out” investor would have been taxed on much higher realized capital gains as each sale would have been a taxable event.)
Let’s look back at the past year. When we buy a stock at Oakmark, we believe it is selling at a large discount to its true value. This means there are essentially two possible versions of what the business is really worth: the consensus view of business fundamentals, as expressed in the current stock price, or our much more positive view of them. During the time we own a stock, we constantly evaluate new information to determine which view is more accurate.
In fiscal-year 2018, new information led us to conclude that the consensus view was probably more accurate than our view of five different holdings: AutoNation, General Electric Company (GE), Harley-Davidson, Qualcomm and Whirlpool. We sold all of those names, with the exception of GE. We’ve found that when our judgment about a business or the people running it has been in error, it is unlikely to quickly turn around, so we typically sell those stocks. GE is different because it now has a new management team, new board members and the divisions that account for most of our valuation case today—Aviation and Healthcare—have performed as expected. Our thesis does not require either a turnaround of GE’s underperforming Power division or that the managers who spent years driving the bus into the ditch now drive it out.
Of the 52 companies we owned on October 1 last year, we conceded we were wrong on our business value estimates for five of them. That isn’t an unusually high error rate and, in fact, the negative effect of those five stocks on the portfolio was more than fully offset by the gain in just one good holding, Netflix. This means there was more to our performance shortfall than just these five stocks.
Instead, what was unusual over the past year was the performance of the remaining 47 stocks, the ones we don’t think of as mistakes. Even though these businesses generally performed consistently with our expectations, 26 underperformed the S&P 500 by more than 1000 basis points (10 percentage points). One reason for this was the unusual divergence across the 500 stocks that comprise the index.
Because the S&P 500 is a capitalization-weighted index, the largest cap stocks have a much greater impact. And although we owned some of those names, they accounted for less of our portfolio. Over half of the S&P 500’s strong performance over the past 12 months was accounted for by just 13 very big stocks (e.g., Amazon, Apple). Consistent with that, the median stock in the S&P 500 underperformed the index by nearly 700 basis points. In a typical year, the median stock is much closer to the index performance. Because we weight positions based on perceived attractiveness rather than market capitalization, our returns usually track closer to the median S&P 500 stock than to the index.
An additional factor was that well over half of our underperforming stocks were in cyclical industries, which tend to be more sensitive to the strength of the broad economy. This list includes banks, industrials, consumer durables (such as autos), airlines and energy companies. If we judged those stocks based on their business results alone, we would have thought the Fund had a pretty good year. But due to investors’ increasing fears of a recession, the stock prices of these economically sensitive businesses performed poorly.
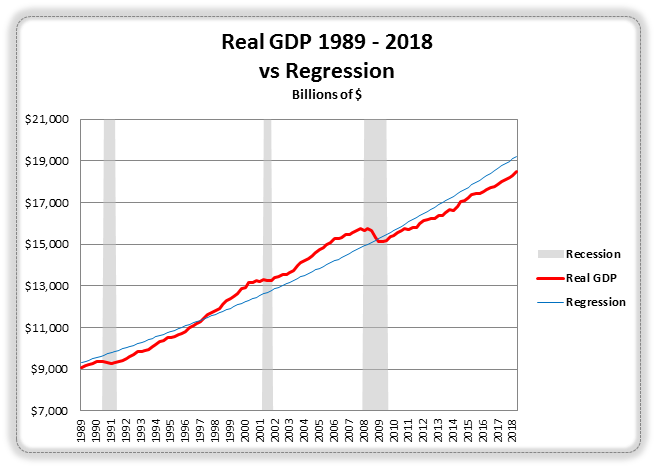
Isn’t it reasonable for investors to expect that after a nine-year recovery, a recession should be right around the corner? Although this recovery may be near a typical expiration date when measured by time, it is nowhere near a typical end when measured by the cumulative amount of above-trend growth. When one looks at recent economic performance—whether analyzing 20 years, 50 years or anywhere in between—it is almost impossible to get a regression line that shows 2018 GDP to be above trend. The chart below, which compares actual GDP from 1988–2018 to a 30-year regression line shows that current GDP has not yet even returned to the trend line.
Although nearly 100% of Oakmark’s research is done bottom up (at the company level) as opposed to top down (making predictions about the economy), our analysis still needs to be based on some economic forecast. The projection our analysts always use is that, in five to seven years, the economy will be “normal,” meaning near a midpoint of boom and recession levels. So, without trying to guess when the next recession will occur, our forecast assumes normal growth, meaning growth in real GDP (adjusted for inflation) averages about 2% per year.
Typically, forecasting that the future will be “normal” isn’t an outlier forecast. Today, because such a high percentage of investors are anticipating a recession, a prediction of normal growth is actually very optimistic relative to consensus. That explains why, when we select the stocks that we believe are most attractive, our portfolios end up with more cyclical exposure. And because most of our companies currently use their earnings to repurchase stock, a brief period of investor skepticism and stock price weakness will actually increase our estimates of their future per-share value.
When business fundamentals outperform stock prices like this, we find stocks more attractive and our investment process takes these metrics into account. We set buy and sell targets for a stock at about 60% and 90% of our estimate of intrinsic value, respectively. When stocks rise above 90% of our estimate of business value, we sell them. At any point in time, our portfolio is a mix of some stocks priced below target and the rest priced between 60% and 90% of our estimate of value. Today, 55% of the Oakmark Fund’s holdings are either below our buy targets or less than 10% above. That compares to a year ago when only 31% were priced similarly. This shift makes the Oakmark Fund more attractive in our view because it means there is greater potential for future returns.
At the end of each calendar year, we disclose the total amount our employees have invested in the Oakmark Funds. Many of us have been buying this year. We now own meaningfully more shares than we did a year ago, which will result in a higher dollar amount being disclosed next quarter, unless there is a significant market decline. We know that we apply the same process that created the long-term track record that was referenced earlier and we apply at least the same level of talent and effort to making our investment decisions. If you don’t agree, you should sell our Funds, regardless of their performance. But if you do agree, and our portfolio positioning sounds logical to you, then consider joining us to take advantage of the recent weakness.
The securities mentioned above comprise the following percentages of the Oakmark Fund’s total net assets as of 09/30/18: AutoNation 0%, General Electric 1.5%, Harley-Davidson 0%, Qualcomm 0%, Whirlpool 0%, Netflix 2.2%, Amazon 0% and Apple 2.9%.
The securities mentioned above comprise the following percentages of the Oakmark Select Fund’s total net assets as 09/30/18: AutoNation 0%, General Electric 3.5%, Harley-Davidson 0%, Qualcomm 0%, Whirlpool 0%, Netflix 0%, Amazon 0% and Apple 0%.
Portfolio holdings are subject to change without notice and are not intended as recommendations of individual stocks.
Access the full list of holdings for the Oakmark Fund as of the most recent quarter-end.
Access the full list of holdings for the Oakmark Select Fund as of the most recent quarter-end.
The S&P 500 Total Return Index is a float-adjusted, capitalization-weighted index of 500 U.S. large capitalization stocks representing all major industries. It is a widely recognized index of broad, U.S. equity market performance. Returns reflect the reinvestment of dividends. This index is unmanaged and investors cannot invest directly in this index.
The Oakmark Fund’s portfolio tends to be invested in a relatively small number of stocks. As a result, the appreciation or depreciation of any one security held by the Fund will have a greater impact on the Fund’s net asset value than it would if the Fund invested in a larger number of securities. Although that strategy has the potential to generate attractive returns over time, it also increases the Fund’s volatility.
Oakmark Select Fund: The stocks of medium-sized companies tend to be more volatile than those of large companies and have underperformed the stocks of small and large companies during some periods.
Because the Oakmark Select Fund is non-diversified, the performance of each holding will have a greater impact on the Fund’s total return, and may make the Fund’s returns more volatile than a more diversified fund.
The net expense ratio reflects a contractual advisory fee waiver agreement through January 28, 2019.
The discussion of the Funds’ investments and investment strategy (including current investment themes, the portfolio managers’ research and investment process, and portfolio characteristics) represents the Funds’ investments and the views of the portfolio managers and Harris Associates L.P., the Funds’ investment adviser, at the time of this letter, and are subject to change without notice.
All information provided is as of 09/30/2018 unless otherwise specified.