Shortly after I moved to Chicago, a good friend introduced me to Earl the ticket broker. Having grown up in Minnesota, I didn’t even know what a ticket broker was. If you wanted to attend an event, you bought tickets from the box office far in advance. And you paid face value. But that wasn’t very effective for an analyst in the investment management industry, given the long and unpredictable hours. It was pointless to buy tickets months in advance and then miss the event because I had to work late. I often found out if an evening would be free only a day in advance. Of course by then, all the popular events were sold out.
At Oakmark, we are long-term investors. We attempt to identify growing businesses that are managed to benefit their shareholders. We will purchase stock in those businesses only when priced substantially below our estimate of intrinsic value. After purchase, we patiently wait for the gap between stock price and intrinsic value to close.
That’s where Earl came in. He knew who had tickets and who was willing to sell them. Earl could get tickets to anything. And I gladly paid his premium price so that the few events I attended could be the ones I was most interested in. Earl had proprietary knowledge and was able to earn a good living from it.
Long after StubHub came on the scene, out of loyalty, I still used Earl. But eventually, StubHub became much cheaper and easier to use. Like most of the old school ticket brokers, Earl closed up shop. Before StubHub, the cost to track down ticket owners who were sellers was prohibitive. With StubHub, that information was one free search away.
A concept that for years has guided our investment thinking is that the Internet makes access to information easier and cheaper. And free-flowing information is bad news for intermediaries. The list of casualties goes far beyond ticket brokers. A travel agent who visited resorts has been replaced by reviews on TripAdvisor. Until recently, a limo service collected half the fare for matching a driver with a rider; now Uber provides that match at a fraction of the price. Retailers could enjoy high margins because comparison shopping was time consuming; now sites like Amazon find the lowest priced seller. Salesforces spun data to make their products look superior; now websites offer unbiased price/performance comparisons. Consumer wins; intermediary loses.
One of our new purchases this past quarter, LinkedIn, has had a similar effect on the employment industry. In the past a good corporate recruiter maintained a proprietary database of employees who were considering changing employers. Within a few weeks of retaining this recruiter, a company could see a flow of candidates that matched its job description. As compensation for that service, the recruiter would receive a percentage of the new hire’s salary. With LinkedIn, a company can now pay a much less expensive subscription fee and see a superior talent pool dominated by candidates not currently looking to change jobs, fully searchable on data the employer chooses. And all of this is available within a few clicks. Lower price, faster service, no adverse selection. If you are a middleman who can be replicated by a computer algorithm, you’re in trouble.
Last month, I sat on a panel discussing the future of investment management amid the growth of passive strategies. As we discussed the evolution of index funds and ETFs, it occurred to me that the asset management business had many similarities to other middlemen being bypassed. When index funds started 40 years ago, much of the asset management industry was charging one percent of assets each year to buy and hold a broadly diversified portfolio of high-quality, large-cap stocks. That allowed the investor to access the higher returns equities achieved compared to bonds, and it was preferable to a stock broker who lost that advantage through frequent trading. But then, index funds came along, which mimicked that same portfolio at almost no cost.
To differentiate themselves from index funds, managers began to define their philosophies as value or growth. Then the indexes followed, establishing sub-indexes to track the “value” and “growth” components separately. Today at very low cost, one can buy an ETF or passive fund designed to track almost any investment style or industry. If you think high-yielding stocks are attractive today (we don’t), you can buy a low-cost ETF that tracks them.
On the panel, I went through my usual arguments about active management: that value can be added either by providing higher return or by taking less risk, but if you define risk as performing differently than the market, you won’t recognize value added through risk reduction. In years when the S&P 500 has declined, the Oakmark Fund has never declined by as much. Yet some conclude the Fund is riskier than the market because our results don’t closely track the market. I think of risk in terms of losing money; most consultants don’t.
I also talked about how professional sports are the same “zero sum games” as active management, but in sports we all agree that there is some predictability of how different teams will perform. Shouldn’t concepts like talent differential, payroll, winning philosophy, team culture, team depth and investment in player development apply just as much to investment management as to sports?
Eventually I talked about a few stocks and areas of the market that we view as unusually attractive. The concepts won’t surprise you as they are heavily represented in our portfolios. We think banks are cheap because investors are overweighting the memory of a once-a-generation financial collapse; commodity prices need to rise to encourage producers to meet increasing demand but the stocks are priced based on current commodity prices; emerging market growth will exceed developed market growth yet companies with strong exposure to those markets aren’t priced at premiums.
Then another panelist made a statement that to me sounded like fingernails on a chalkboard: “I agree with Bill that ‘value stocks’ are cheap, and that’s why I own our value ETF.” Is there ever a time when “value stocks” aren’t cheap? If so, what does the term “value” even mean? One of my biggest pet peeves is when consultants label companies with the most desirable characteristics “growth stocks” and deem companies with the least desirable characteristics “value stocks,” and their distinction is independent of stock price. But this panelist’s statement helped crystalize for me what we at Oakmark do that a computer doesn’t.
It’s easy for a computer to create a basket of high P/E stocks and another of low P/E—or, for that matter, high versus low on a price-to-anything metric. And it is easy to see when the premium for the “high” stocks gets large relative to history, as my fellow panelist had observed. But very few of our investments at Oakmark rest solely on the idea that a currently low P/E will normalize. Value, to us, is much more complex than whether the trailing P/E ratio is above or below average.
A stock like Alphabet (formerly Google) isn’t likely owned in a value ETF due to its growth rate and P/E ratio both being higher than average. But the P/E ratio is giving no credit to non-earning assets such as its large cash balance, the value of its venture cap portfolio (like autonomous cars) or YouTube—which, based on hours of viewing, would be worth hundreds of dollars per share if valued like cable networks. Adjust the P/E for these assets, and Google Search is priced like a below-average business.
LinkedIn is another company I’ve never seen in a value index. Its rapid revenue growth clearly qualifies it as a growth business. We believed that margins for LinkedIn would be consistent with, or higher than, other Internet and business service companies if it was not so heavily investing in early-stage opportunities in adjacent businesses. If we were right, then LinkedIn was selling for less than the price implied by putting a market P/E on earnings from its employment services businesses. As these examples show, at the right price, growth businesses are value stocks. Microsoft’s offer to acquire LinkedIn suggests they agree with us.
Energy stocks, as below average businesses, are often called value stocks. They tend to have low P/E ratios when the price of oil is unsustainably high, and high P/Es (or even lose money) when the price of oil is unsustainably low. We think they are often cheap at times when P/Es are high or negative (like many are today) and expensive when the P/Es are low. The P/E can be misleading when the “E” is highly cyclical.
Most utilities, packaged food and mature pharmaceutical companies possess characteristics often thought of as typical for value stocks: high free cash generation, high quality balance sheets and high dividend payouts. Through much of my career, these stocks sold below the market P/E ratio because their growth rates were below average. But today, their high dividend payouts make these stocks attractive bond substitutes, and as such, they sell at much higher P/Es than they have historically. Are they value stocks today? We don’t think so.
Perhaps someday a computer algorithm will be able to decide how to normalize earnings and know which ratio best represents the intrinsic value of each company. It will be intelligent enough to know that a stock isn’t tagged “value” or “growth” based on business characteristics, but will know instead that at the right price, any company can be a value. Then, and only then, can a computer construct an index of truly attractive stocks. But until that time, and I doubt that breakthrough will come during my career, the portfolios we construct at Oakmark won’t be duplicated with index or ETF investments.
The asset management industry has been slow to respond to index fund competition. Active managers need to be active. Index hugging used to be an effective way to avoid underperforming enough to get fired. Of course, it also eliminated the opportunity to achieve very good performance. Today, index huggers deserve to be fired and replaced by an index fund. An investment manager has to do something that a computer can’t easily replicate, and it has to justify its fee through higher return or lower risk. If you examine the long-term records of any of our Funds at Oakmark, I’m confident you’ll conclude that we are earning our fees.
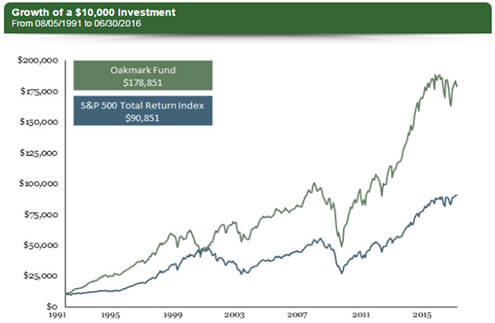
Last, I’d like to leave you with a reminder about the folly of selecting managers solely based on historical performance. One of the questions I was asked on that panel was, “What is a fair time period to judge the performance of an active manager?” The Oakmark Fund will celebrate its 25th anniversary later this year. Look at the chart comparing a $10,000 investment in the Oakmark Fund to the same investment in the S&P 500 and see how much better off the Oakmark Fund investor ended up.
Using monthly data, we looked at the Oakmark Fund results for rolling time periods from one to 10 years. Just over half of the one-year periods showed underperformance, as did nearly one-third of the five-year periods. Even lengthening the time horizon to 10 years showed underperformance in over 20% of the periods. An investor who bought the Fund after good performance periods and sold it after bad would have achieved miserable performance, despite the Fund’s great 25-year track record (and great 15-year record after the first 10-year return period). That’s why we always emphasize our philosophy and process rather than our recent returns. If the Oakmark philosophy and process are as sound as we believe they are, then periods of underperformance create an opportunity for profit.
Average Annual Total Returns (as of 06/30/2016)
| Fund | 1-Year | 3-Year | 5-Year | 10-Year | Inception |
|---|---|---|---|---|---|
| OAKMX | -2.99% | 8.65% | 11.32% | 8.20% | 12.28% |
| S&P 500 Total Return | 3.99% | 11.66% | 12.10% | 7.42% | 9.27% |
*Expense Ratio (as of 09/30/2015): 0.85%
Fund Inception: 08/05/1991
Past performance is no guarantee of future results. The performance data quoted represents past performance. Current performance may be lower or higher than the performance data quoted. The investment return and principal value vary so that an investor’s shares when redeemed may be worth more or less than the original cost.
The holdings mentioned above comprise the following percentages of the Oakmark Fund’s total net assets as of 06/30/16: StubHub, Inc. 0%, Tripadvisor, Inc. 0%, Uber International C.V. 0%, Amazon.com, Inc. 0%, LinkedIn Corp. 1.6%, Alphabet, Inc., Class A 0.6%, Alphabet, Inc., Class C 2.4%, Youtube, LLC 0%, and Microsoft Corp. 2.1%
The holdings mentioned above comprise the following percentages of the Oakmark Select Fund’s total net assets as of 06/30/16: StubHub, Inc. 0%, Tripadvisor, Inc. 0%, Uber International C.V. 0%, Amazon.com, Inc. 0%, LinkedIn Corp. 5.4%, Alphabet, Inc., Class A 0%, Alphabet, Inc., Class C 7.6%, Youtube, LLC 0%, and Microsoft Corp. 0%
The holdings mentioned above comprise the following percentages of the Oakmark Global Select Fund’s total net assets as of 06/30/16: StubHub, Inc. 0%, Tripadvisor, Inc. 0%, Uber International C.V. 0%, Amazon.com, Inc. 0%, LinkedIn Corp. 0%, Alphabet, Inc., Class A 0%, Alphabet, Inc., Class C 7.5%, Youtube, LLC 0%, and Microsoft Corp. 0%
Click here to access the full list of holdings for the Oakmark Fund as of the most recent quarter-end.
Click here to access the full list of holdings for the Oakmark Select Fund as of the most recent quarter-end.
Click here to access the full list of holdings for the Oakmark Global Select Fund as of the most recent quarter-end.
Portfolio holdings are subject to change without notice and are not intended as recommendations of individual stocks.
The S&P 500 Total Return Index is a market capitalization-weighted index of 500 large-capitalization stocks commonly used to represent the U.S. equity market. All returns reflect reinvested dividends and capital gains distributions. This index is unmanaged and investors cannot invest directly in this index.
The Price-Earnings Ratio (“P/E”) is the most common measure of the expensiveness of a stock.
The Oakmark Fund’s portfolio tends to be invested in a relatively small number of stocks. As a result, the appreciation or depreciation of any one security held by the Fund will have a greater impact on the Fund’s net asset value than it would if the Fund invested in a larger number of securities. Although that strategy has the potential to generate attractive returns over time, it also increases the Fund’s volatility.
Oakmark Select Fund: The stocks of medium-sized companies tend to be more volatile than those of large companies and have underperformed the stocks of small and large companies during some periods.
Because the Oakmark Select Fund & Oakmark Global Select Funds are non-diversified, the performance of each holding will have a greater impact on the Funds’ total return, and may make the Funds’ returns more volatile than a more diversified fund.
Investing in foreign securities presents risks that in some ways may be greater than U.S. investments. Those risks include: currency fluctuation; different regulation, accounting standards, trading practices and levels of available information; generally higher transaction costs; and political risks.
The discussion of the Funds’ investments and investment strategy (including current investment themes, the portfolio managers’ research and investment process, and portfolio characteristics) represents the Funds’ investments and the views of the portfolio managers and Harris Associates L.P., the Funds’ investment adviser, at the time of this letter, and are subject to change without notice.